 |
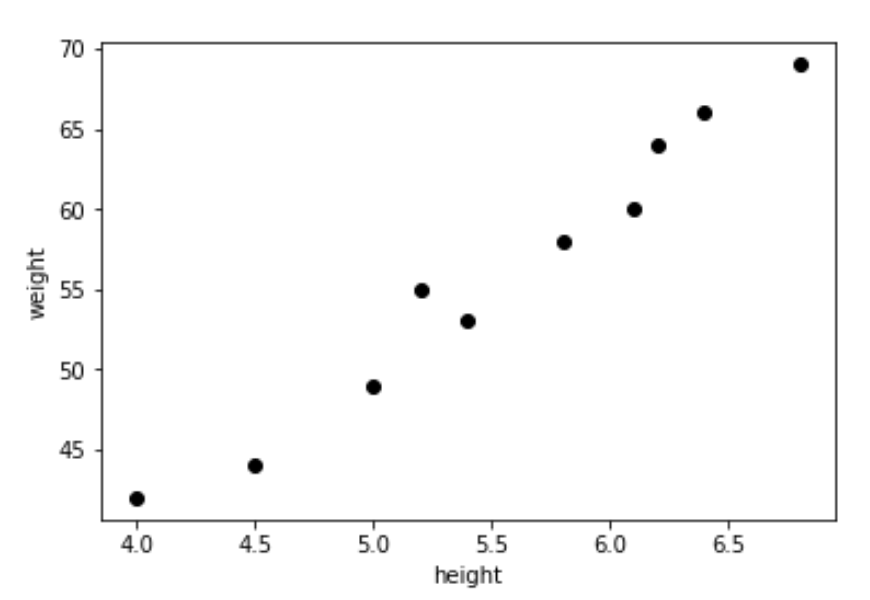
| Collection of points from a random data set. Source |
When we work with real world applications, we oftentimes get individual data points as opposed to a finished model. Oftentimes, in order to model this data, we will need to find a "curve" of best fit for the points and the graph, allowing us to interpolate and cautiously extrapolate values within the context of our problem. An example of a data set is shown above, and you almost can see how you would want to draw a line through it, as has been done with the data set below.
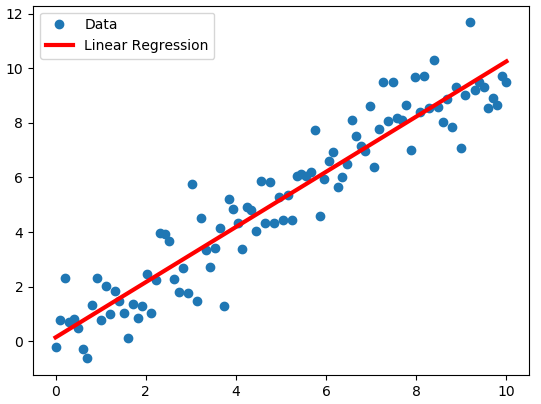 |
| The model fits the data. Source |
The next question is, how do you, based on the individual data points, generate the linear regression model shown above. Without getting into the mathematics of deriving the equation, there are two formulas you'll need to generate an equation for data of the form: A + Bx, where a is the y-intercept and b is the slope. These are:
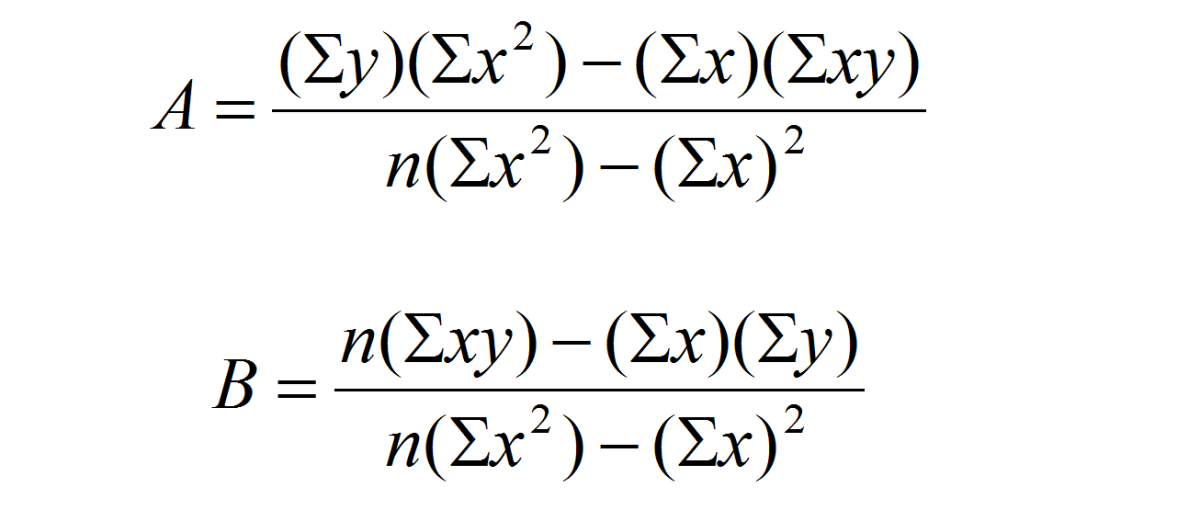 |
| Equations. Source |
where ∑ stands for summation (i.e. add up all of the terms in the list). The following spreadsheet shows some of these calculations:

Your challenge is to create a problem that given a list of points, is able to print out the a and b values of the linear regression. Here is a suggestion for how to represent your initial set of x-y pairs.

Another tip is to break apart your summation calculations into individual pieces as I did in the spreadsheet and to then combine all the parts at the end for when you are calculating your a & b values. This will make it easier to organize the program.
 Lastly, you can graph your final equation and points into an application such as desmos to make sure that your outputs make sense.
You could also try to download graphing software for use in your Java programs as outlined in this tutorial.
Extension #1: In the real world, a line is not going to fit every data set. Quadratic curves are some of the most recognizable objects in mathematics, and can also be fit to data sets.
If you wish to see an example of this in action, head on over to the source and scroll to the "find by hand" section (he does it nicely with an excel spreadsheet). In our case though, actually performing the summations across our points is not really the challenge anymore. Rather, once those calculations are complete, we are left with three equations with three unknowns. This fits rather nicely into a 3x4 matrix.
You may remember the strategy for solving these kinds of linear systems: continuously eliminating variables until you solve for one, then another until you solve the system. When we did the problems by hand, we strategically eliminated variables which matched up well between the equations. Here we don't need to worry about cherry-picking a particular strategy because the computer won't mind performing what we would consider difficult operations by hand. Therefore, the whole process lends itself well to algorithmic programming.
As before, you can test your final values for the quadratic equation with the list of points in an online graphing calculator.
Good Luck!

Your challenge is to create a problem that given a list of points, is able to print out the a and b values of the linear regression. Here is a suggestion for how to represent your initial set of x-y pairs.

Another tip is to break apart your summation calculations into individual pieces as I did in the spreadsheet and to then combine all the parts at the end for when you are calculating your a & b values. This will make it easier to organize the program.
Lastly, you can graph your final equation and points into an application such as desmos to make sure that your outputs make sense.You could also try to download graphing software for use in your Java programs as outlined in this tutorial.
Extension #1: In the real world, a line is not going to fit every data set. Quadratic curves are some of the most recognizable objects in mathematics, and can also be fit to data sets.
 |
| Whoa! Source |
You may remember the strategy for solving these kinds of linear systems: continuously eliminating variables until you solve for one, then another until you solve the system. When we did the problems by hand, we strategically eliminated variables which matched up well between the equations. Here we don't need to worry about cherry-picking a particular strategy because the computer won't mind performing what we would consider difficult operations by hand. Therefore, the whole process lends itself well to algorithmic programming.
 |
| Strategy to solve systems of linear equations. Source |
As before, you can test your final values for the quadratic equation with the list of points in an online graphing calculator.
Good Luck!
you could always just use a ti-inspire. But this will also work
ReplyDelete