Regression to the Mean

Have you wondered why tall parents usually have smaller children, and vice versa? Galton discovered this and wondered why the children seemed so 'mediocre' than their parents. He then proceeded to coin this phenomenon 'regression towards mediocrity' [1].

Now named 'regression to the mean', this phenomenon is now considered an important factor to consider for valid research. When a variable that involves some randomness deviates significantly from a norm, regression to the mean states that it is likely a subsequent measurement will return a value that is closer to the expected norm.


Measurements 1 and 2 were taken from the same material and is represented by the red and blue lines, respectively.

This graph shows data for two measurements of a liquid and solid heterogeneous sample for its G'' values at different stresses. For each measurement, a minute amount of sample is taken from a container and placed into the measurement device. What is important is the massive fluctuations in the first measurement at low stresses is lessened and returns closer to its expected norm (represented by the gray dotted line) after the second measurement.

Why does this happen?

Heterogeneous mixtures can make taking a
 representative sample for testing more difficult.
Significant fluctuations from the norm can be caused by many factors such as human error, however regression to the mean is most applicable to non-systemic random errors. An example of such as error would be taking non-representative samples for testing (a sampling error). In order to get a certain measurement from a sample we need to collect a smaller representative sample from it to test. Random errors arise when taking such a sample, especially with heterogeneous mixtures. This is most likely the case for the example above; instead of taking a representative sample from this mixture in both measurements, it is likely that the sample taken from the container in measurement 1 was non-representative and contributed to unexpected deviations from the norm. Lastly, if we consider a common normal distribution we know that potential outlier values can result on rare occasions. Subsequent measurements are more likely to fall near the mean since it is more probable such values are to occur. This is actually one of the methods taken advantage of in p-hacking, where researchers purposely manipulate their research in a way that produces a rare and significant result that is often non-reproducible.


How it applies to research

Experimental research, where tests are conducted on two different experimental groups, allows researchers to accurately determine causal relationships between variables. If research was only done on one group of participants, regression to the mean would most likely produce favorable results for the researcher. Consider a clinical trial of a drug that is used to cure a disease. The researcher would gather a bunch of participants sick from such a disease, and allow the participants to take the drug. Regression to the mean would state that the most unhealthiest of the participants would likely get better as their health would get closer to the 'average human' - healthy. The researcher may then conclude that the drug is the cause of the participants getting better, but this is simply a case of regression to the mean. Testing on two representative groups - where one is given the drug in question and the other either a placebo or a competitor's drug, eliminates any biased conclusions that are based off regression to the mean.

As another example, research was done on if praise or punishment was better for pilots in terms of their quality of flight landings. When pilots made a landing which was better than average, they were praised. If they made a particularly bad landing, they were punished. Since regression of the mean states that in either case it is likely the pilot will subsequently return to a more 'average' landing quality, it was incorrectly concluded that punishment is more effective as a teaching tool than praise, since punished pilots whose previous bad landing was out of the norm improved on subsequent landings [2].


An example of the landing quality score of the pilots versus their landing number. Regression of the mean played a big part in the research performed to identify the effectiveness of praise vs. punishment for pilots as shown in this image.

Is regression to the mean applicable to everyday life?

Of course! Have you ever tried searching for a perfect online webpage to do some work (be it a good online grammar checker, plagiarism checker, useful SEO tool, etc.) and stumbled on a horribly made one out of the norm? If you're randomly trying to find another webpage, you're likely to click on a better webpage than the one before. This assumes that the indexing of the webpages involves some randomness which there is. It also assumes that the search engine isn't choosing to showing all horrible online webpages for you.

Interested in stock prices and finance? Mean reversion is based off of regression to the mean and states that sudden surges in stock prices will eventually die down and return back to the long-term average. This is based off the assumption that the short term price surge does not attract much attention media-wise and isn't announced prominently.

Even these examples don’t top how this phenomenon is the most applicable to life. 

We've all had bad days and sometimes we wonder whether or not having a bad day yields a succession of these days. When you're having a particularly bad day out of the norm, rest assured mathematically due to regression to the mean, your next day is likely to be better than before! :)

Have a nice day!


[1] Galton, F. (1886). Regression Towards Mediocrity in Hereditary Stature. The Journal of the Anthropological Institute of Great Britain and Ireland, 15, 246-263. doi:10.2307/2841583

[2] Morton, V., & Torgerson, D. J. (2003). Effect of regression to the mean on decision making in health care. BMJ (Clinical research ed.), 326(7398), 1083-4.


Images and image data belongs to KrIsMa.

L-Hospital's Rule for Indeterminate Forms

L-Hospital's Rule should only be used when you have an indeterminate form. These are shown by the table below. The first two indeterminate forms are the most common varieties.

Source: https://math.stackexchange.com/questions/1581721/list-of-indeterminate-forms-in-mathematics
L-Hospital's Rule states that you take the derivative of the numerator and then the denominator and try to take the limit at the same value of that function. If this results in an indeterminate form, you will need to repeat the process. Here are two examples:


The second example uses L-Hospital's Rule four times because of the repeated appearance of indeterminate forms. 


Limits in Calculus

Obj. 1: Limit Notation & Basic Definition


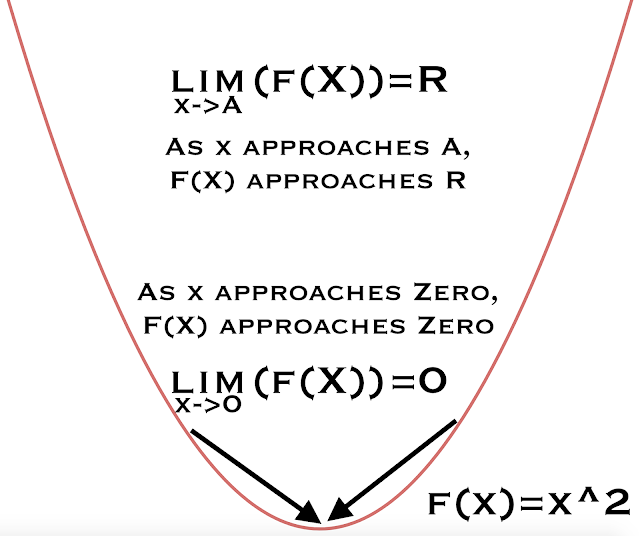
Limits are defined as follows: As an x-value approaches an argument, the two sides of the curve approach the same number. The example above shows the limit as the x-value approaches zero, the two sides of the curve approach zero. When taking the limit of a continuous function (such as x^2), the limit will be equal to the function value (y-value) of said function.

Obj. 2: Reviewing continuous functions. 
Correctly match up the letter number to the name of the function.

Options: Rational (1), Trigonometric (2), Logarithmic (3), Power (4), Polynomial (5), Exponential (6).

Answers can be found at the bottom of the article.

Polynomial, rational, power, exponential, logarithmic, and trigonometric functions are continuous over their respective domains. Therefore the limit of arguments in the domains will be equal to the function value.

Obj. 3: Limits and Discontinuity 

Limits can also be taken at points of discontinuity.

From left to right: y = x^2 (a continuous function), y = (x^3)/x which has a removable discontinuity at x=0 (not defined),
 y = (x^3)/x which has a jump discontinuity at x=0 (b/c this has been defined to be four arbitrarily),
 and y=1/(x^2) - discontinuity due to a vertical asymptote. 
The limit can still be taken because it looks at what value the function approaches as opposed to how the function is (or isn't) defined at that function. This concept will be revisited when we explore limits which do not exist. The main idea here is that continuity is not a requirement for the existence of a limit.

Obj. 4: Estimating Limits Graphically

Limits can be estimated graphically through human approximation (i.e. it looks to be one) or with a table where values are taken at different intervals reasonably close to the value of the limit. This is a very useful technique when the value is not defined at a certain function. The example below uses the graph of (x^3)/(x) and a table to find a limit at that argument.


Here is a practice problem. Given that there is a removable discontinuity (shown in purple) at x=.8, what is the limit as x approaches .8 of x^3 given the information in the table?


Obj. 5: Evaluating Limits Algebraically 

Source: https://www.youtube.com/watch?v=kjhng0sFBxs

The above limit laws can be used to simplify different problems or other limits when they cannot be solved through traditional direct substitution, simplification or rationalization. Substitution involves plugging in the number, simplification usually involves factoring, and rationalization involves multiplication by a conjugate. An example of the last technique is shown below.

Source: https://www.youtube.com/watch?v=rUvabvlCBo0 

Obj. 6: Formal Definition of Continuity 


A function is continuous at a specific point/argument if that argument is in the domain of the function, the limit exists and that point, and if these two values are equivalent to one another.

Example: Prove that x^2 is continuous at x=0.

Is it defined at x^2? Yes! y = 0^2 = 0


Is the limit defined at 0? Yes! Based on our previous knowledge modules, the limit of x^2 as the argument approaches zero is zero.


Are the two values equal? 0 = 0.


Obj. 7: One-Sided Limits

When taking the limit with a table, you examine the arguments from both sides of the limit to determine. You can also describe limits from just one-side of the limit. This provides two options: the left-hand limit (denoted by a - (dash) on the argument value) and the right-hand limit (denoted by a + (addition sign) on the argument value). See the example below using (x^3)/x.


Obj. 8: Nonexistent Limits


Limits do not technically exist if the limit is unbounded (i.e. goes to infinity), although these can still describe the behavior of a function. Limits also do not exist if the function oscillates around the argument or if the left and right hand limits are not equivalent. The following graphs illustrate these principles.

A.) The limit of 1/x at zero does not exist because the left and right hand limits aren't equivalent (right hand limit = + infinity), (left hand limit = - infinity).

B.) The limit of 1/x^2 at zero does not exist because it is unbounded but the statement is still correct when you are trying to describe the general behavior of the function.

C.) The limit of sin(1/x) at zero does not exist because the function begins to oscillate as you approach the value.

D.) The limit of |x|/x at zero does not exist because the left and right hand limits aren't equivalent (left hand limit = -1), (right hand limit = +1)

Obj. 9: Limits & Infinity

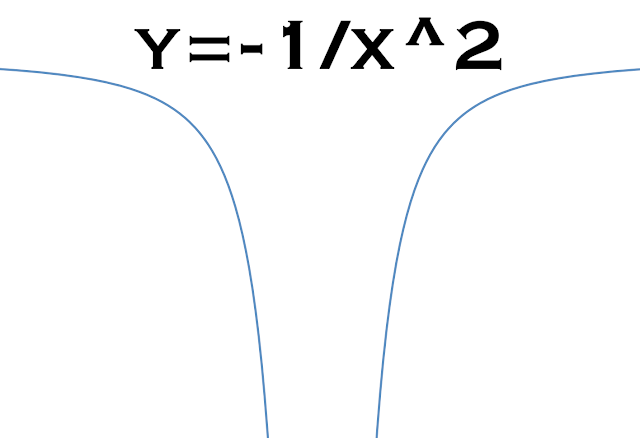
A limit can be described as heading towards infinity if both sides of the asymptote trend in that direction. The earlier example y= 1/x^2 showed a graph trending in the +infinity direction at x=0. Below is the graph of -1/x^2 which trends in the -infinity direction.


Limits can also be taken infinitely in order to solve for horizontal asymptotes. This harks back to previous content involving top-heavy (degree of numerator > degree of denominator), equal (degree of numerator = degree of denominator) and bottom-heavy (degree of numerator < degree of denominator) functions.

The rules still apply when the limit argument is taken to infinity (as is the case below). If the function is bottom heavy, the limit equals zero (i.e. the horizontal asymptote is x=0). If the function is top-heavy, the limit equals +infinity (i.e. the horizontal asymptote doesn't exist), and if the two degrees are equal you can solve for the value by divided both the numerator and denominator by the variable to the greatest degree. All terms less than this drop off when you take the limit to infinity. This process is exemplified by the example below.

Source: https://secure-media.collegeboard.org/digitalServices/pdf/ap/sample-questions-ap-calculus-ab-and-bc-exams.pdf

Based on this calculation, the graph of the function above should have a horizontal asymptote at y=3. Here is a representation of this and you can see that the graph does have a horizontal asymptote that it is trending to:


Obj. 10: Intermediate Value Theorem, Extreme Value Theorem, Mean Value Theorem 

Once more we will return to the topic of continuity because it an essentially condition for the three theorems mentioned above. Here are graphical explanations for these theorems.
Source: https://math.la.asu.edu/~arce/mat210_web/lessons/Ch3/3_4/3_4ol.htm
The Intermediate Value Theorem states if you have a continuous function, and define (a,f(a)) and (b,f(b)),
there must be at least one argument between a and b for all function values between f(a) and (b).
Source: https://brilliant.org/wiki/intermediate-value-theorem/
The mean value theorem is also conditional on having continuous function. After taking the slope between the points (a,f(a)) and (b,f(b)), you will know that there must be at least one point on the curve where the slope is equal to this "secant" slope.   Source: Robert Ortiz (https://commons.wikimedia.org/wiki/File:Mvt2.svg)
This discussion of slopes as mentioned in the definition of the Mean Value Theorem will begin to matter very much in the lesson on Derivatives

Answers:

First Practice (Matching Functions to Graphs): A - 5, B - 1, C - 4, D - 6, E - 3, F - 2 

Second Practice (Limit based on Table): The limit is approx. .511 or .512.

Credits:

Graphs were made with Desmos and the Symbolab Graphing Calculator.